How was 2017 for you? Have you learned Rust? Have you invested in Bitcoin? Was it the year of Linux desktop (again)?
In this post, I’d like to see how was the last year for fellow hackers, through Hacker News’ public dataset on Google BigQuery.
Google BigQuery has interesting public datasets and Hacker News is one of them. Deedy Das already did a lot of interesting analysis in 2015, that covered 9 years from 2006. Most of the SQL queries below are taken from his post.
Technically people can upvote/downvote last year’s stories on Hacker News. There is no “archive” mode like Reddit as far as I know. If you run the queries again, the numbers would be a bit different.
Top Stories
Let’s start from the simplest one. What was the most upvoted stories in 2017?
I mainly used Google Cloud Datalab to get the numbers. %%bq query lets Datalab (which is basically Jupyter Notebook) interrepts a cell as a SQL on BigQuery. If you use BigQuery’s console, you may need #standardSQL instead.
%%bq query
SELECT title, url, score, id, timestamp FROM `bigquery-public-data.hacker_news.full`
WHERE type = 'story' AND extract(year FROM timestamp) = 2017
ORDER BY score DESC LIMIT 30
Here is the result. Apparently, it was the year of Silent Breakers, even for Hacker News.
Commonly Shared/Upvoted Domains
As Deddy did, let’s see the commonly shared and upvoted domains.
%%bq query
SELECT
  domains_2017.domain,
  COUNT(1) AS count,
  SUM(score) AS score
FROM (
  SELECT
    REGEXP_EXTRACT(url,r'^https?://(?:www.)?([^/]*)/?(?:.*)') AS domain,
    score
  FROM
    `bigquery-public-data.hacker_news.full`
  WHERE extract(year FROM timestamp) = 2017) domains_2017
GROUP BY
  domains_2017.domain
ORDER BY
  count DESC
LIMIT
  30
The result is not that different from what he got, while there were some new comers like Hacker Noon, Quartz and arXiv.org.
Also note that the top of the actual result was “no domain”, that means “Show HN”, “Ask HN”, … those which don’t have external links.
| Domain | Count | Score | |
|---|---|---|---|
| 1 | medium.com | 17631 | 138515 |
| 2 | github.com | 15074 | 223278 |
| 3 | youtube.com | 9076 | 39402 |
| 4 | nytimes.com | 6004 | 144996 |
| 5 | techcrunch.com | 4867 | 93204 |
| 6 | bloomberg.com | 3970 | 105908 |
| 7 | arstechnica.com | 3039 | 55587 |
| 8 | theguardian.com | 2993 | 51159 |
| 9 | theverge.com | 2552 | 32952 |
| 10 | youtu.be | 2464 | 2527 |
| 11 | hackernoon.com | 2323 | 15092 |
| 12 | goo.gl | 2264 | 2267 |
| 13 | bbc.com | 2116 | 43956 |
| 14 | wired.com | 2002 | 22822 |
| 15 | en.wikipedia.org | 1923 | 14552 |
| 16 | twitter.com | 1861 | 32666 |
| 17 | wsj.com | 1858 | 26364 |
| 18 | washingtonpost.com | 1725 | 47134 |
| 19 | theatlantic.com | 1477 | 26339 |
| 20 | qz.com | 1376 | 23305 |
| 21 | arxiv.org | 1299 | 22885 |
| 22 | reuters.com | 1251 | 29259 |
| 23 | bbc.co.uk | 1247 | 25250 |
| 24 | linkedin.com | 1215 | 4939 |
| 25 | businessinsider.com | 1206 | 12800 |
| 26 | reddit.com | 1184 | 15607 |
| 27 | economist.com | 1032 | 19168 |
| 28 | forbes.com | 1031 | 9085 |
| 29 | cnbc.com | 1006 | 10749 |
I might be a visual thinker, or simply bad at understanding numbers. Let’s have a scatter plot to see the relationship between the two variables.
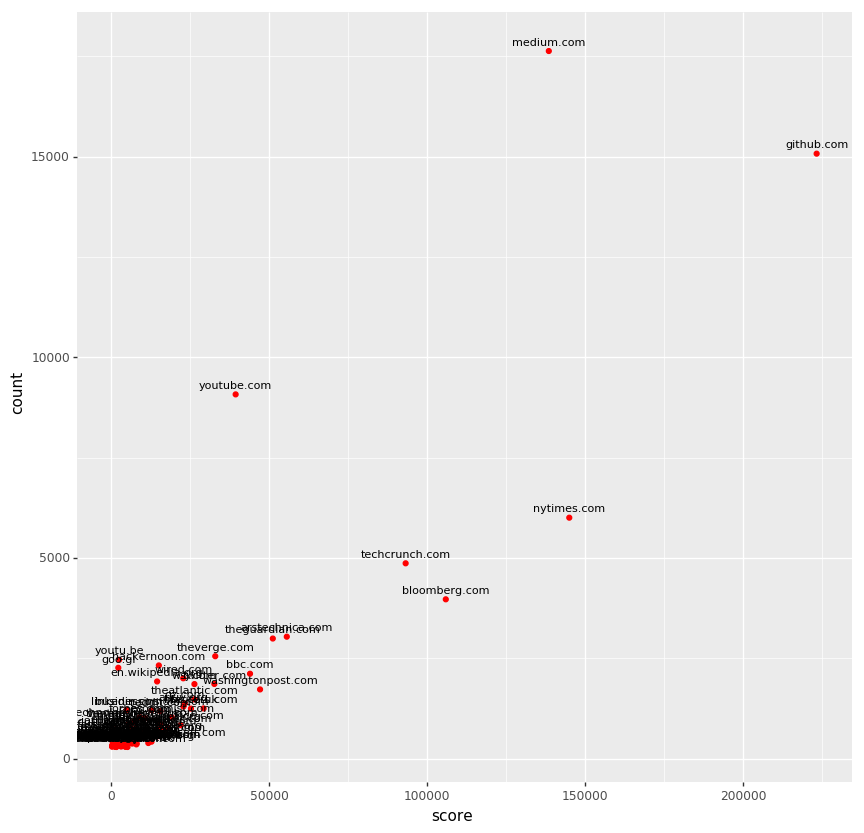
While GitHub was still the king of Hacker News in term of the number of upvotes, Medium was the most shared domain in 2017.
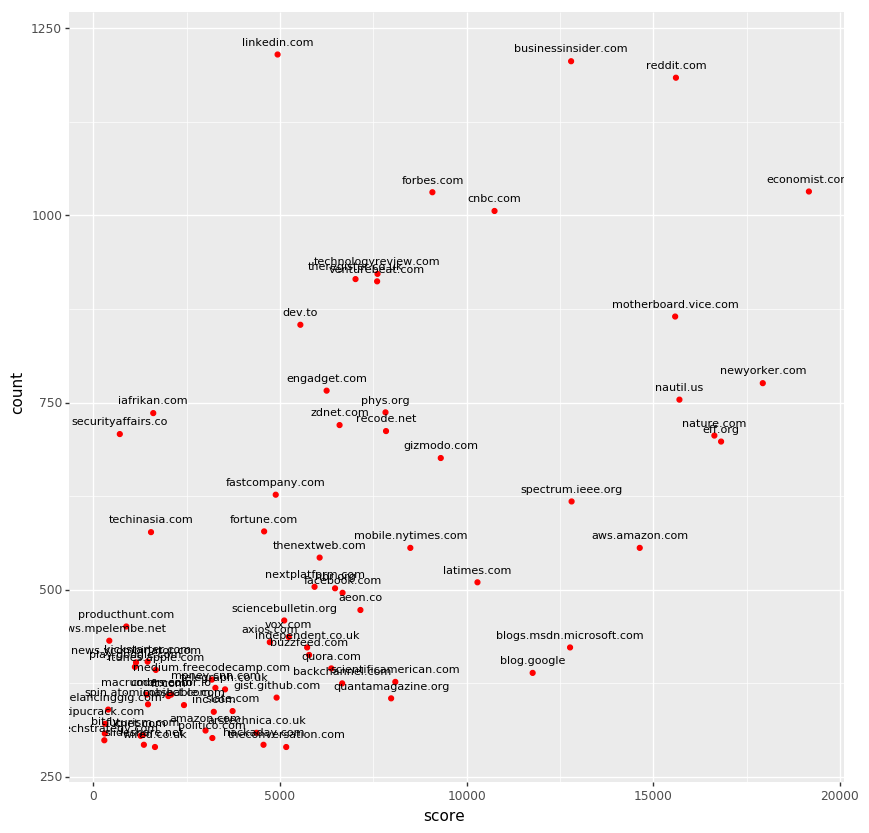
The unreadable chuck on the above graph had below. There were a lot of commercial news sites from tech-focused ones (e.g. Verge, Wired) to newspapers (e.g. Wall Street Journal, Washington Post). Also you can see URL shorteners in the frequenty shared but rarely upvoted area.
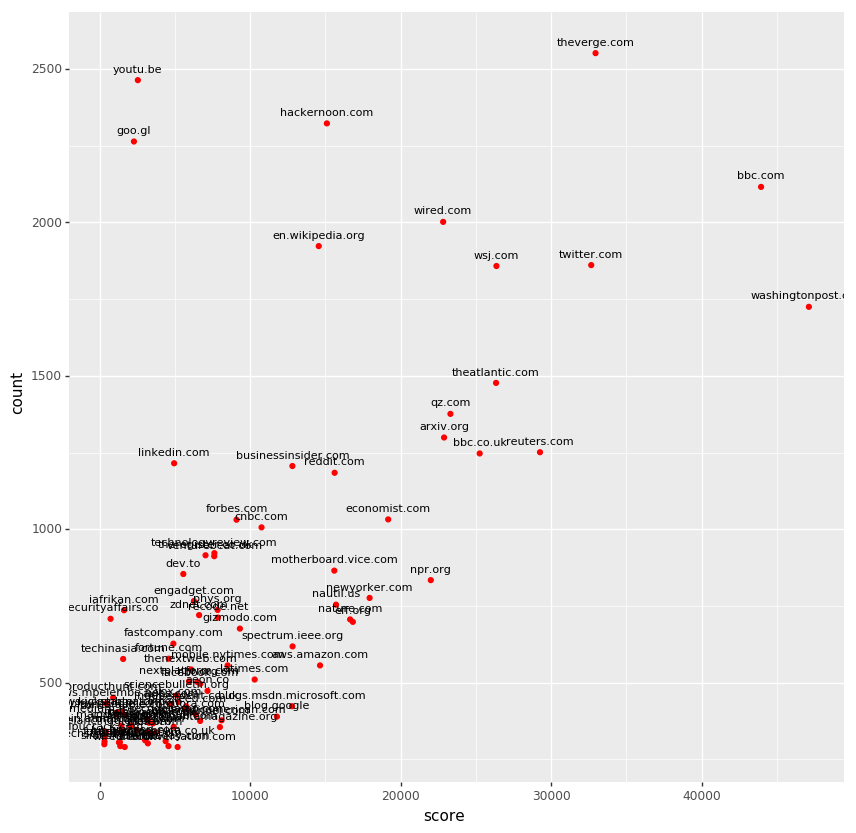
The area also had Tech in Asia, iAfrikan and Security Affairs, which were constantly shared by few users. The opposite side of the domains are corporate blogs (blog.google, blog.,sdn.microsoft.com) which were not shared frequently, but earned relatively a lot of upvotes.
Commonly Used/Upvoted Words
Let’s see words in the titles.
%%bq query
SELECT word, SUM(score) AS score, SUM(1) AS count FROM
  (SELECT word, score FROM
    (SELECT SPLIT(LOWER(title), ' ') AS words, score FROM
      `bigquery-public-data.hacker_news.full` WHERE EXTRACT(year FROM timestamp) = 2017) AS word_list_and_score
   CROSS JOIN UNNEST(word_list_and_score.words) AS word) AS words_2017
GROUP BY word
ORDER BY score DESC LIMIT 100
The result has a lot of stopwords such as “the”, “to”, “a”, … Instead of manually filtering all of them, I used nltk to filter the words.
import google.datalab.bigquery as bq
import pandas as pd
import nltk

nltk.download('stopwords')
stopwords_set = set(nltk.corpus.stopwords.words('english'))

popular_words = bq.Query('''
SELECT word, SUM(score) AS score, SUM(1) AS count FROM
  (SELECT word, score FROM
    (SELECT SPLIT(LOWER(title), ' ') AS words, score FROM
      `bigquery-public-data.hacker_news.full` WHERE EXTRACT(year FROM timestamp) = 2017) AS word_list_and_score
   CROSS JOIN UNNEST(word_list_and_score.words) AS word) AS words_2017
GROUP BY word
ORDER BY score DESC LIMIT 100
''')
df = popular_words.execute(output_options=bq.QueryOutput.dataframe()).result()
df['is_stopword'] = df['word'].apply(lambda x: x in stopwords_set)
Here is the result. As I previously mentioned, “Show HN”, “Ask HN” were very big in Hacker News. “hn:“, “ask” “show” would be coming from these posts. Having “new” is legitimate since this is Hacker News.
Compared to Deddy’s analysis, the lack of “startup” is sad to mention. Is the golden age of the startup already over?.
| Word | Score | Count | |
|---|---|---|---|
| 1 | hn: | 372149 | 25460 |
| 2 | – | 331221 | 31388 |
| 3 | ask | 197909 | 14216 |
| 4 | show | 182118 | 12264 |
| 5 | new | 140168 | 12149 |
| 6 | 122544 | 6786 | |
| 7 | data | 87319 | 7522 |
| 8 | learning | 76060 | 4803 |
| 9 | web | 72250 | 4758 |
| 10 | using | 72102 | 6149 |
| 11 | [pdf] | 68817 | 3939 |
| 12 | code | 63777 | 4174 |
| 13 | open | 63403 | 3674 |
| 14 | programming | 57602 | 2704 |
| 15 | uber | 54909 | 2295 |
| 16 | first | 53480 | 4279 |
| 17 | software | 50981 | 4106 |
| 18 | 50661 | 3054 | |
| 19 | python | 50385 | 2686 |
| 20 | (2016) | 50080 | 1093 |
| 21 | us | 49712 | 3254 |
| 22 | go | 48328 | 2570 |
| 23 | linux | 45372 | 2096 |
| 24 | app | 45326 | 6031 |
| 25 | make | 45233 | 3978 |
| 26 | apple | 45196 | 2981 |
| 27 | use | 45134 | 3698 |
| 28 | years | 45037 | 1906 |
| 29 | people | 44934 | 2432 |
| 30 | machine | 44700 | 2892 |
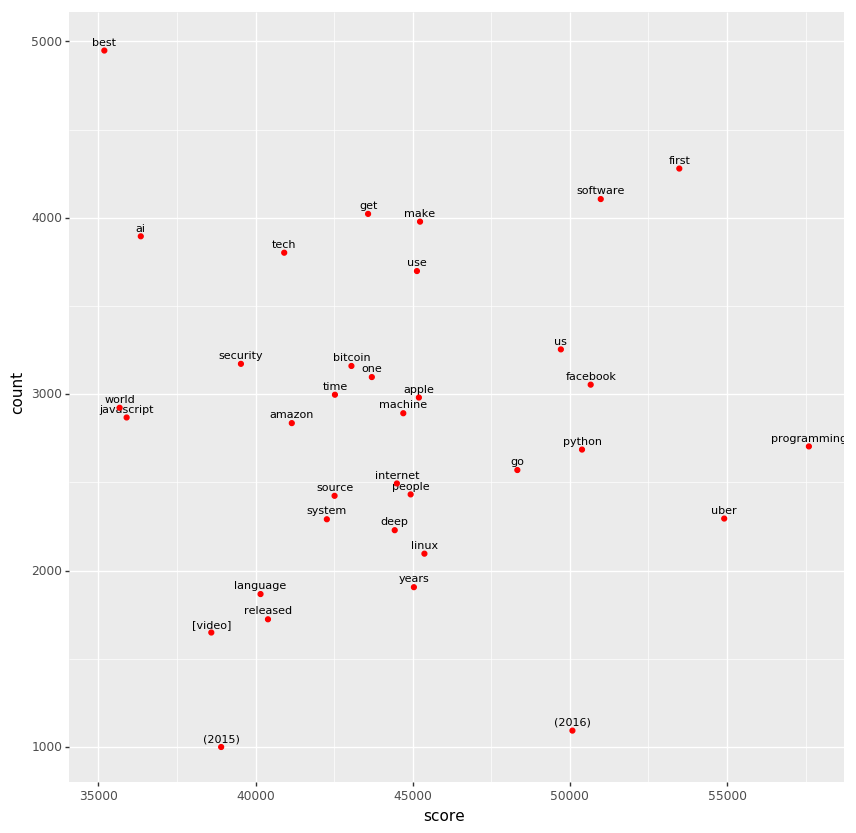
Let’s make a scatter plot again. Here is the big picture.
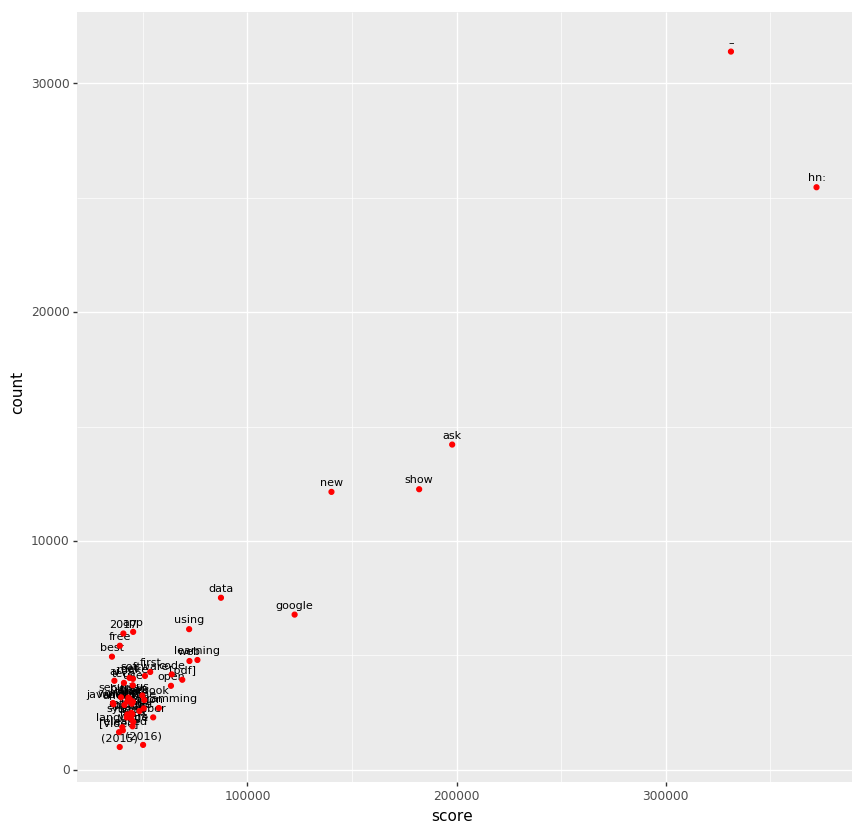
In below, the contrast between “learning” vs. “ai” is interesting. There were a lot of stories about “ai”, but they didn’t get much upvotes compared to “learning”, which would be a part of “machine learning” or “deep learning”.
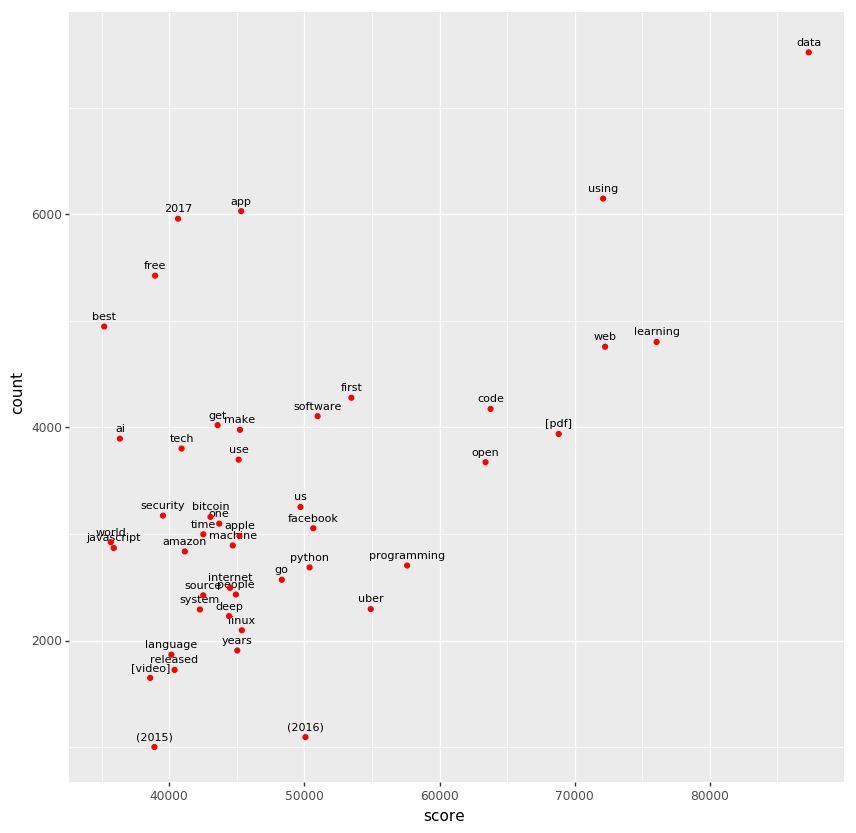
You can find four programming languages here; JavaScript, Go and Python. There were a lot of JavaScript stories, but they didn’t get much upvotes, compared to Go and Python. JavaScript Fatigue? Go would have Amazon Go and Go as a borad game though.
What’s next?
There are a lot of questions I can ask;
- I was sometimes comparing Deddy’s 9 years analysis vs. 2017, but it would be interesting to see Year-over-Year to see some trends, like, when did we lose “startup”?
- I solely checked stories, but how about comments?
- It was a bit annoying to use ggplot()1 multiple times with different parameters to explore the results. Can I use something different to explore the results interactively?
- Would it be able to build a web app to explore the results?
I probably will not do all of them, but would try a few. Stay tuned!
- By the way, I was using plotnine to have ggplot in Python. ↩︎