I recently finished Udacity’s Intro to Machine Learning, while I haven’t finished the final assignment yet. The next step may be learning Deep Neural Network but before that, I’d like to see what I can do with what I’ve learned.
The course was using Enron email dataset a lot, and I want to use something similar but not the same to recap things. The dataset should have messages, authors, … How about Git repositories?
But before starting the machine learning part, the first step is loading a Git repository into Python.
GitPython
There are multiple Python libraries that can interact with Git. I’m unsure which would be the best, but GitPython is good enough for me.
First, I convert a Git repository (I used facebook/react) into a JSON file.
import git
import json
...

def commit_summary(c):
    result = {}
    for path, stats in c.stats.files.iteritems():
        for k in stats:
            result[k] = result.get(k, 0) + stats[k]
    result['file_count'] = len(c.stats.files)
    result['committed_date'] = c.committed_date
    result['hexsha'] = c.hexsha
    result['message'] = c.message
    result['email'] = c.author.email
    return result

react = git.Repo('../react')

with open('react-commits.json', 'w') as out:
    out.write('[\n')

    commits = react.iter_commits('master')
    index = 0
    for c in commits:
        if index != 0:
            out.write(',\n')
        index += 1

        json.dump(commit_summary(c), out)

    out.write(']\n')
Then load the JSON file into Pandas.
import pandas as pd
...

commits = pd.read_json('react-commits.json')
commits['committed'] = pd.to_datetime(commits['committed_date'], unit = 's')
React Commits over Time
The Y-axis have insertions and deletions.
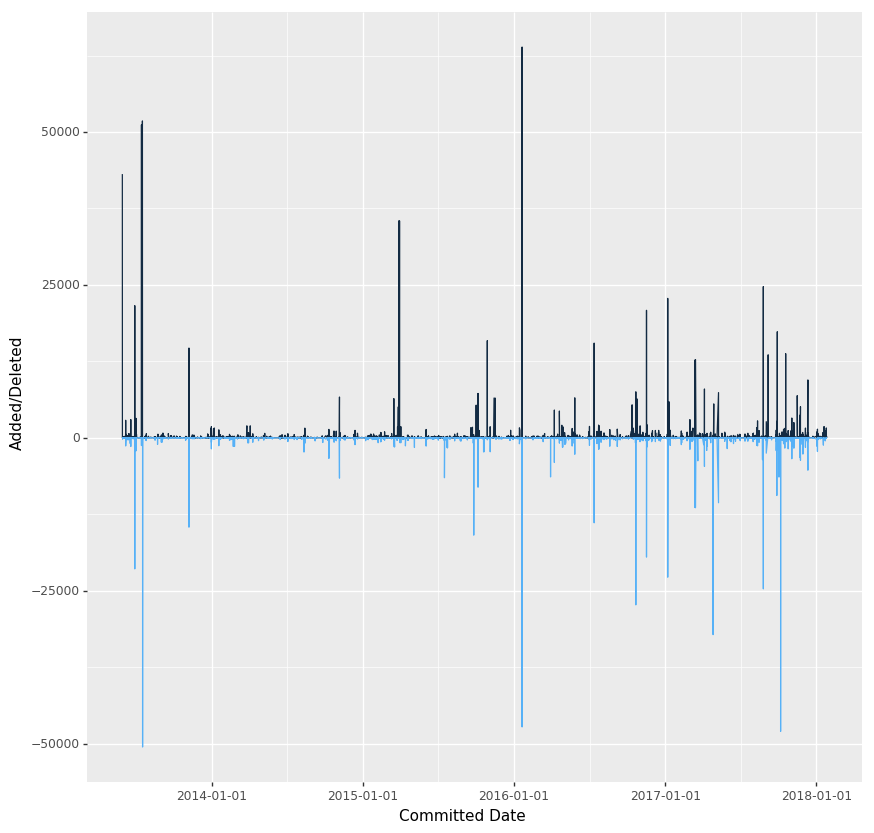
ggplot(aes('committed', 'insertions'), commits) + \
  geom_line(aes(color = 1)) + \
  geom_line(aes('committed', '-deletions', color = 2)) + \
  ylab('Added/Deleted')  + xlab('Committed Date') + \
  guides(color=False) + scale_color_gradient()
There are a few spikes on deletions (newer to older);
- Delete documentation and website source (#11137)
- [site] Load libraries from unpkg (#9499)
- New Documentation
- Merge remote-tracking branch ‘facebook/master’
- remove likebutton from docs for now
While most of them were administrative changes, the last, oldest commit was a bit funny;
it has some facebook-ism in there and it’s probably shouldn’t be on the site.
I would agree so :)
React Committers
This plot, React commiters in the Y-axis is aesthetically pleasing. It would be interesting to compare that to similar projects, such as Vue or Angular.
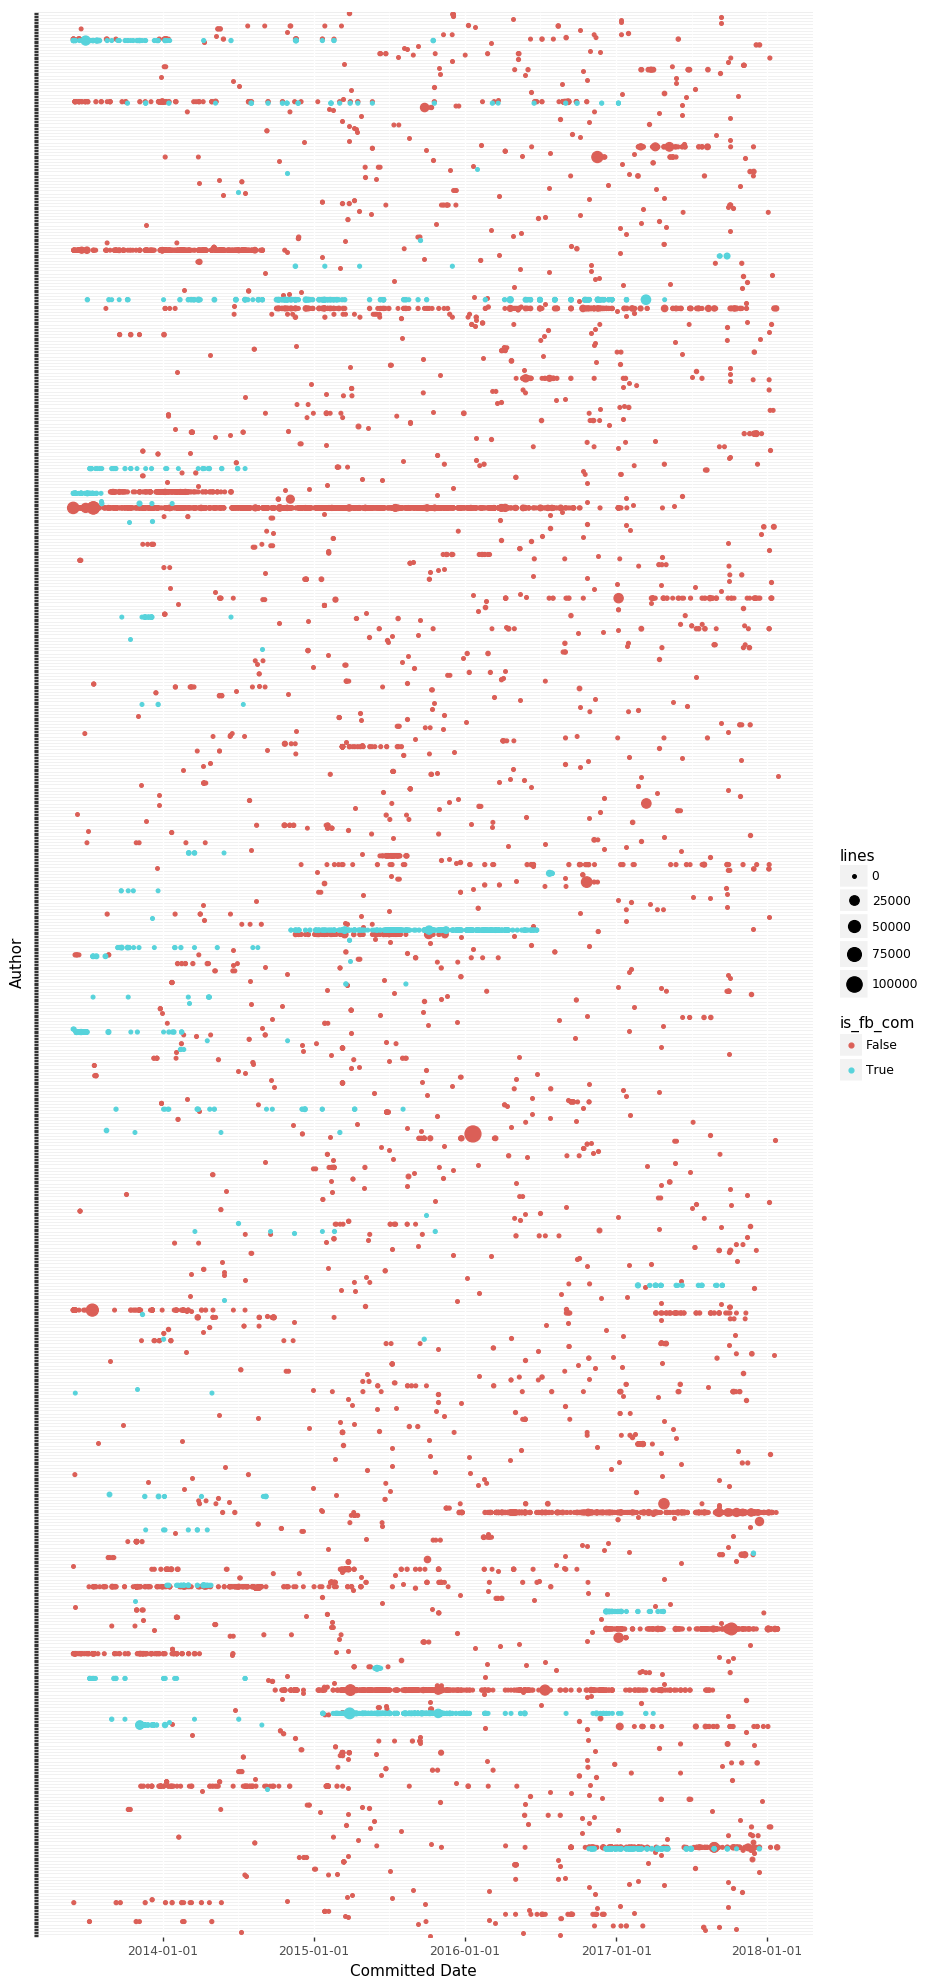
commits['is_fb_com'] = commits['email'].str.contains('@fb.com')

ggplot(aes('committed', 'factor(email)', color='is_fb_com'), commits) + \
  geom_point(aes(size = 'lines')) + \
  ylab('Author')  + xlab('Committed Date') + \
  scale_y_discrete(labels = [])
The amount of commits from non-fb.com email addresses is surprising. I wanted to use that as an indicator of Facebook employees, but that may be too naive.